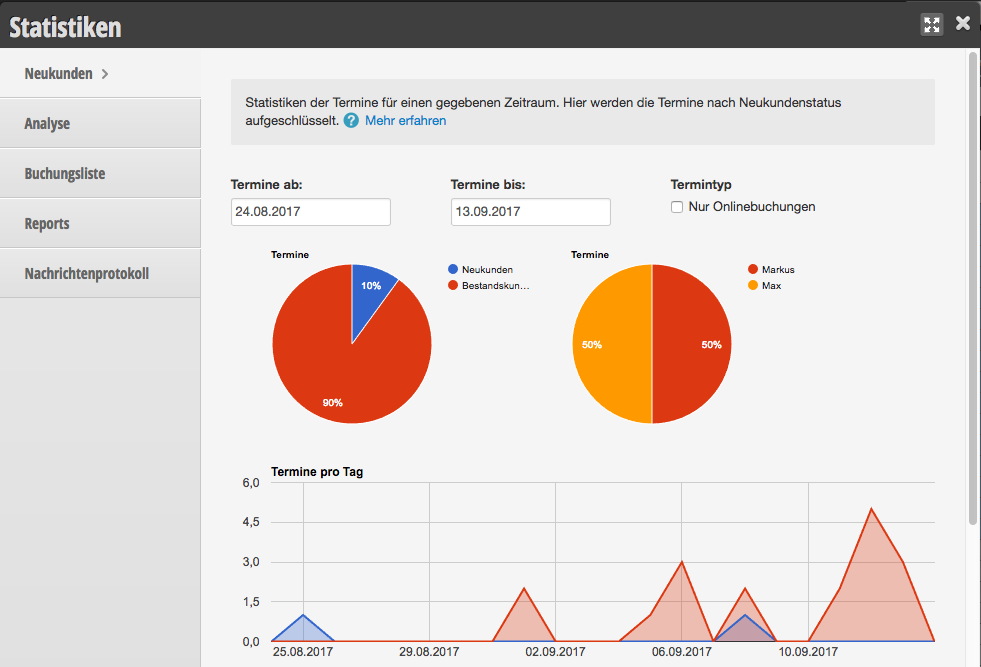
In the "Information" section, you can view statistics about your online bookings. In the Online New Customers section, you can see how your bookings are categorized by new customers/regular customer status.
- The first statistic shows the total ratio between new customers and regular customers.
- The second pie chart shows the distribution of online bookings among individual staff members.
- The timeline shows you how online bookings have developed over the last 30 days.
- Finally, the bottom graph allows you to see how the distribution of new to regular customer bookings is for individual staff members.