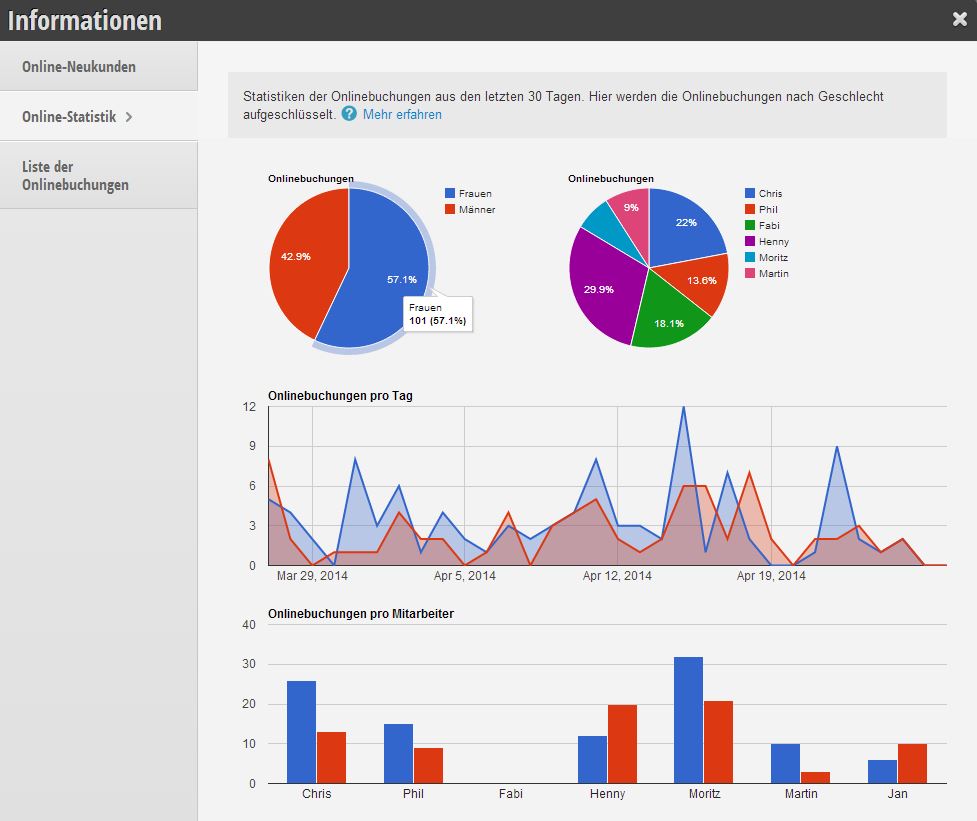
In the Analysis section, you can see the breakdown of your bookings by gender, as well as by your selected employees.
- The first statistic shows the total ratio between women and men.
- The second pie chart displays the distribution of online bookings among individual employees.
- The time progression shows you how online bookings have developed over the last 30 days.
- In the bottom graph, you can see how the distribution of women to men varies for each individual employee.